| STREAM Online Help > Example Scenario | <<Previous | Next>> |
This section runs through a simple example scenario that illustrates various features of the STREAM web demo.
The following example provides a step-by-step tutorial in using the client to register two streams and run a simple query over them.
1. Register the first stream, "R"
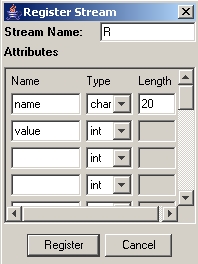
The first step is to make the system aware of streams over which data will be sent. This is similar to creating a table in a conventional relational database. To register a stream, click the " Register Stream" command button in the commands pane (described earlier) or select the "Register Stream" option from the Command Menu. The following dialog should be displayed (but with empty text fields):
The "Stream Name" field specifies the name of the stream to register, and the Stream Attributes field specifies the schema for the stream. For this example, we will register a stream R with two attributes, an attribute name with is a string of maximum length 20, and an attribute value which is an integer, by filling in the text fields as shown in the above figure and clicking the Register button.
The Plan Display pane (described earlier) will now show the list of registered streams, i.e., the only registered stream R.
2. Register the second stream, "S"
We will next register a second stream S with the same schema as R (first attribute name of type char(20) and second attribute value of type integer) exactly as in step 1. After this step, you should see a stream list in the main display window as below:

3. Register a query over these streams
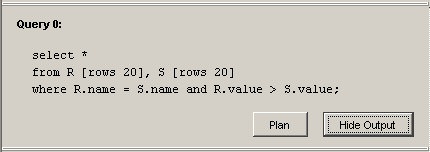
We will now register a simple join query over these two streams. To register the query, click on the "Register Query" button on the commands pane or select the "Register Query" option from the Command menu, which produces the following dialog:
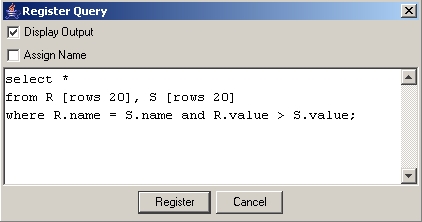
Enter the query shown in the image above, and then click the Register button. This particular query is a join on the attribute "name" and "value" over windows of the last 20 rows of streams R and S.
The main display window now switches from "Registered Streams/Relations view" to "Registered Queries view", which shows the list of currently registered queries. You can switch back to the "Registered Streams/Relations view" by selecting that option from the View menu.
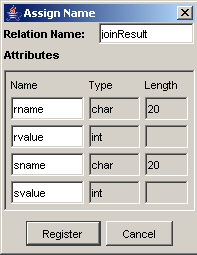
Note: Notice that there are two check-boxes, Display Output and Assign Name on the top of the Register Query dialog. If the Display Output box is selected the output of the query is shown to the user. If the Assign Name option is selected the user can assign a name to the output of the query. This effectively registers a view with the system, and this view can be referenced in future queries.
For example, had we checked Assign Name option for the query above, the following dialog would have popped up for us to fill in the names of the output (relation) and its attributes. This relation could then have been referenced in future qeries.
4. Generate Plan
For this example scenario, we will not register any more queries. We will next have the system generate the plan for the above query. Click on the "Generate Plan" button in the Commands pane or select the "Generate Plan" option from the Command menu.
Now in the query list that was shown in the main display pane, for each registered query (we only have one), there will be a button Plan enabled.
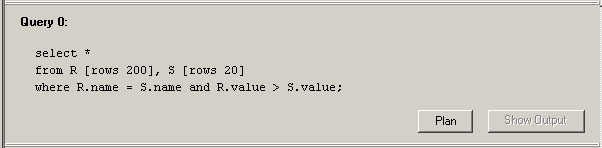
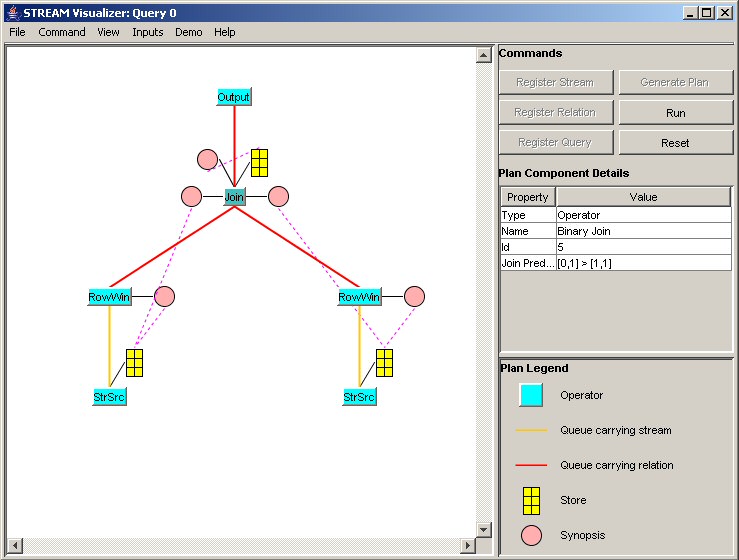
Click this button to see the corresponding query execution plan. A query execution plan consists of operators, the entities that perform the actual data processing, queues that transfer tuples from one operator to another, synopses that contain operator state, and stores that manage memory. The legend pane identifies the symbols used to represent various components in a plan. Technical details of the plan components can be found in the user manual.
Click on a few of the plan components and notice that their properties show up in the "Plan Component Details" pane on the right. Plan components can be dragged around in the "Plan Display" pane.
5. Bind data files to stream inputs
We will next input the data corresponding to the streams R and S. The client can send tuples that are stored in a text file to the stream server. To do this, go to the Inputs menu, and select the stream name R, This will bring up the following control:
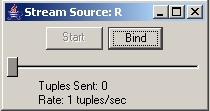
The Start button is used for beginning sending tuples to the server. But it will be disabled until you bind a valid input text file for the stream, so let's save it for later. A slider control is used for adjusting the rate at which tuples are sent to the server, but it is also disabled. Now, let's click on the Bind button, this will bring up another dialog, in which you can specify which text file we will use for this stream.
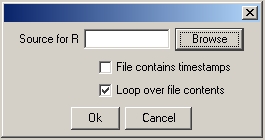
Please click Browse button. We have provided example data files as part of the demo, they are located in the .stream/scripts subdirectory in your home directory. Select the file R.load and click "ok".
Note: Notice that there are two checkboxes in the Bind dialog: check the "File contains timestamps" option to tell the system that the input text file already contains timestamps, so that the stream server will use these timestamps instead of the default local system time. Check the "Loop over file contents" option to send tuples in the input text file over and over again; otherwise, tuples will be sent just once. For this example, you don't need to change the default settings. For more information about the input text file format, please see here.
After successful binding, the Start button and the slider will be enabled.
Please select S from the Inputs menu and bind file .stream/scripts/S.load to it.
6. Start Running
We will now start executing the query. Click the "Run" button on the Commands pane or select the "Run" option from the Command menu. This brings up the query result window on the screen. Click the Start button for streams "R" and "S" to begin sending input tuples. Now you should see query results appearin in the results window. Please see here for a brief introduction to CQL semantics.
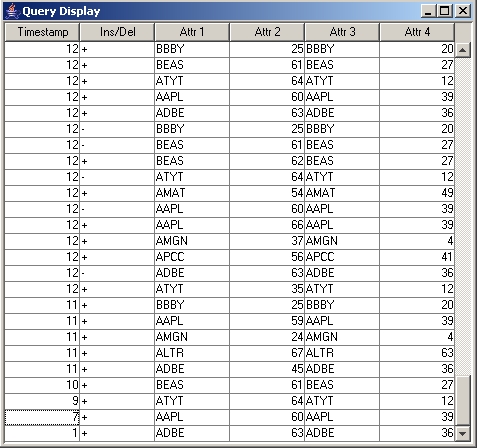
The result display window shows query results in increasing timestamp order from bottom to top (i.e., newer tuples on the top), and this window is srollable. Only the last 10,000 output tuples are shown in the window, and the older ones are dropped.
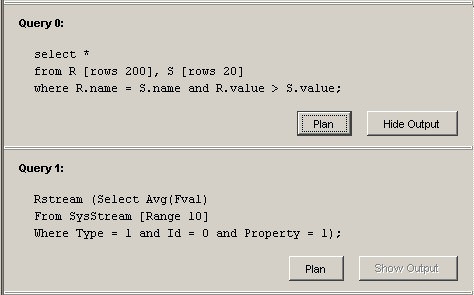
As mentioned earlier, the View menu can be used to to view different parts of the client state: the set of registered streams, the set of registered queries, and the plans for the various queries. The view of all registered queries is particularly useful: When the queries are running, each query has two enabled buttons: the Plan button lets you see the query plan, and Show Output/Hide Output button lets you show/hide its result. This feature can be handly when there are a large number of queries.
7. Set up an attribute (property) monitor (optional)
Once the query is executing, we can add attribute monitors to track its performance characteristics. For this example, we'll add a simple monitor that tracks the average rate of tuple flow on a queue.
First, right click on the queue directly beneath the output operator at the top of the query plan. The following context menu will be displayed:
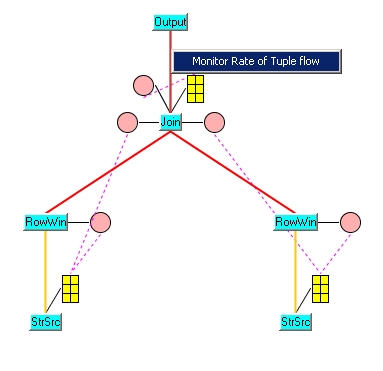
Select the Monitor Rate of Tuple Flow option, which brings up the following dialog:
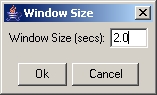
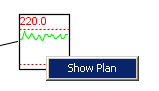
This dialog box lets you specify the "averaging window" For example, the value 2 indicates the the monitor will report the average rate of tuple flow in the queue taken over the last 2 seconds. Click Ok, and a small graph will appear next to the queue.
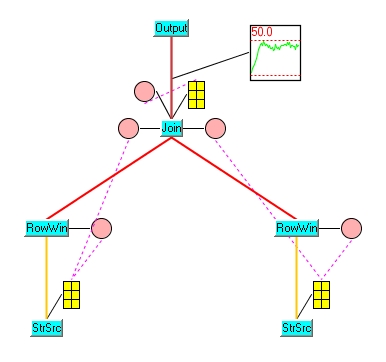
As tuples flow through the system and out of the output operator at the top, the rate of tuple flow in tuples per second will be shown on this graph. Increasing the rate of flow on streams R and/or S will increase the rate of flow out of the system, and lowering them will lower the rate, as expected.
Essentially, a monitor is just another internal CQL query that runs over a special system stream. You can also see the execution plan for this monitor query by right clicking on the monitor graph and select Show Plan in the context menu.
Alternatively, you may notice that in the View menu, this new monitor query has been added into the drop-down list. Selecting this item will show its execution plan in the "Plan Display" pane. You can also see this query if you select Registered Queries from the View menu. As mentioned above, this view is pretty handy in navigating among multiple registered queries. For example, you can easily switch back to the original plan view by clicking the Plan button next the the original query (Query 0).
More details on attribute monitors are provided later.
| STREAM Online Help > Running the System | <<Previous | Next>> |
Last modified: Thu Jan 27 2005